MSA Type 2 · Crossed Gage R&R · ANOVA
Separating repeatability, reproducibility and part variation
Follow a balanced crossed study in which three operators measure the same ten parts twice. The example shows how ANOVA separates sources of variation and how the resulting components are read.
Study design
Every operator measures every part
The source vignette describes ten randomly selected parts and three operators. Each operator measures each part twice, with parts presented in a randomized, blinded order. The published response vector is artificial and was created for teaching, so it does not reproduce proprietary customer or VDA QMC data.
Input preparation
Long-form data that QualityFirst can map directly
CSV preview
| Operator | Part | Repeat | Measurement |
|---|---|---|---|
| A | 1 | 1 | 23 |
| A | 1 | 2 | 20 |
| A | 2 | 1 | 22 |
| A | 2 | 2 | 24 |
| A | 3 | 1 | 23 |
| A | 3 | 2 | 21 |
Preview: six of 60 rows. The Repeat column is traceability information.
Column mapping
- Operator
- Appraiser identifier; map to Operator.
- Part
- Common part identifier; map to Part.
- Repeat
- Measurement occasion; retained for traceability.
- Measurement
- Numeric response; map to Measurement.
The source does not define specification limits, so this example does not calculate %Tolerance. No acceptance limits are entered.
Statistical model
Four possible sources of observed variation
Part, operator, their interaction and repeatability are separated before the Gage R&R components are assembled.
Repeatability
Variation between repeated readings made under the same part–operator combination. In the ANOVA model it is represented by residual variation.
Reproducibility
Variation associated with operators and, when retained, the way operator differences depend on the measured part.
Calculated result
Interaction decision and variance components
ANOVA with interaction
| Source | DF | SS | MS | F | p |
|---|---|---|---|---|---|
| Operator | 2 | 20.63 | 10.317 | 8.597 | 0.00112 |
| Part | 9 | 107.07 | 11.896 | 9.914 | 7.31×10⁻⁷ |
| Operator × Part | 18 | 22.03 | 1.224 | 1.020 | 0.46732 |
| Residual | 30 | 36.00 | 1.200 | — | — |
Why the reduced model is used
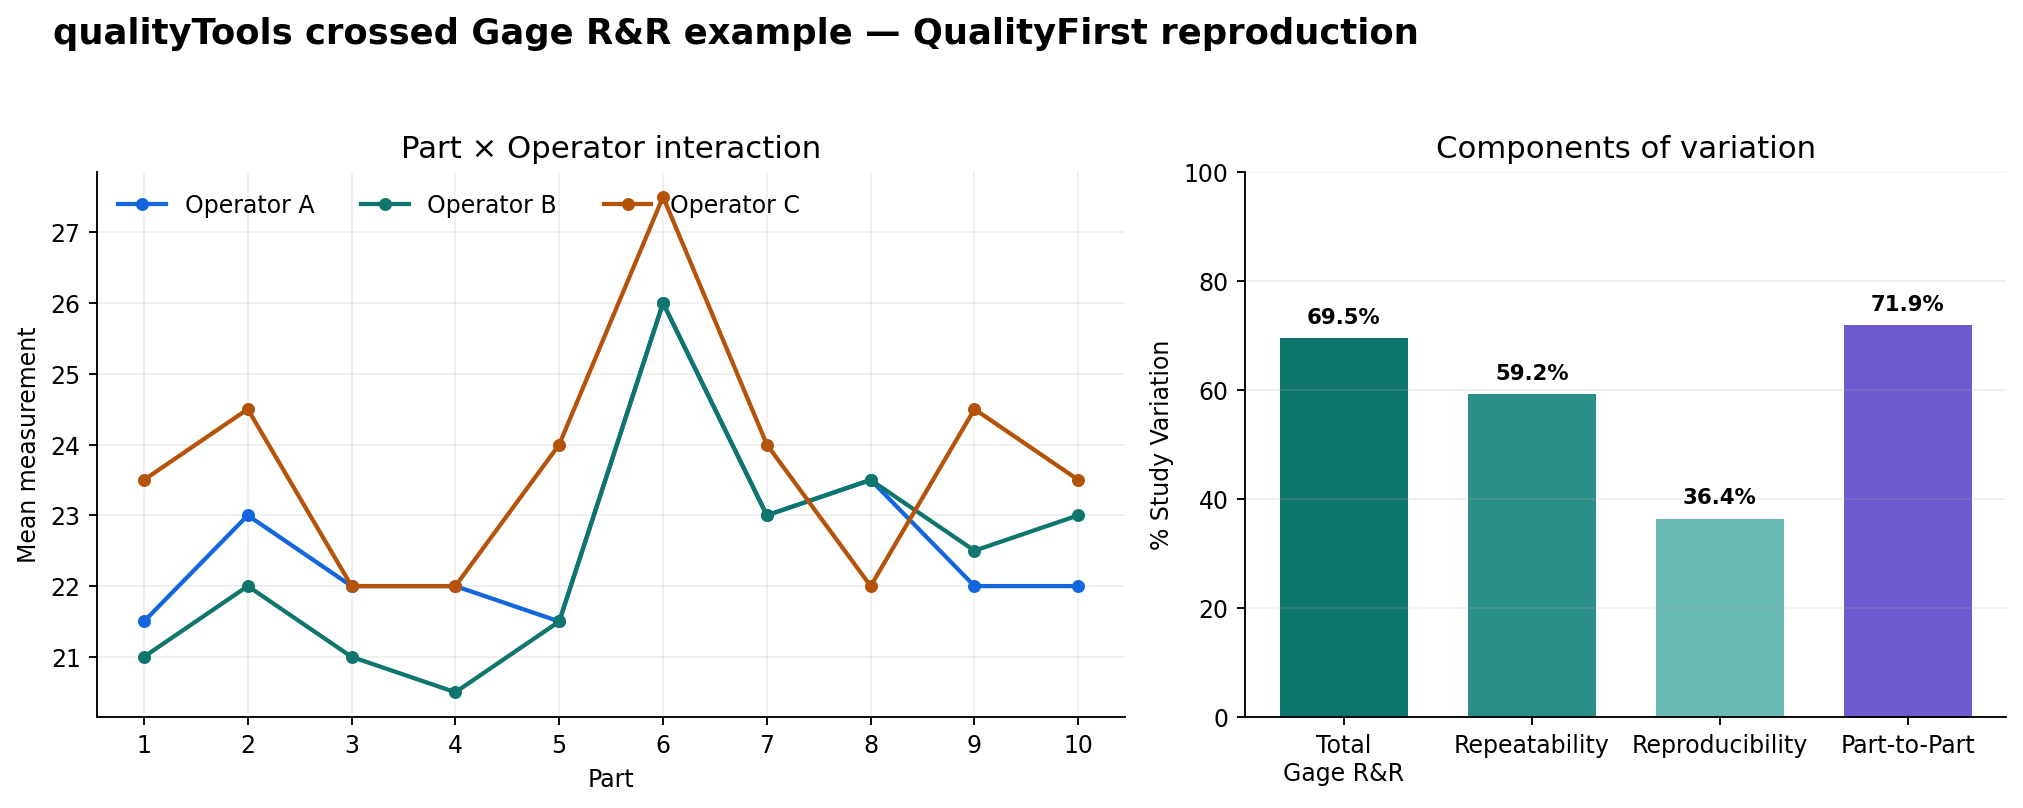
The operator-by-part interaction gives p = 0.46732. With the displayed QualityFirst setting α = 0.25, it is not retained. Its variation is pooled into the residual and the final components come from the model without interaction.
The interaction decision is a model-selection step. It is not an acceptance decision about the measurement system.
Final reduced-model components
| Source | Variance component | Standard deviation | 6 × SD | %Study Variation |
|---|---|---|---|---|
| Total Gage R&R | 1.664 | 1.290 | 7.74 | 69.5% |
| Repeatability | 1.209 | 1.100 | 6.60 | 59.2% |
| Reproducibility | 0.455 | 0.675 | 4.05 | 36.4% |
| Part-to-Part | 1.781 | 1.335 | 8.01 | 71.9% |
| Total Variation | 3.446 | 1.856 | 11.14 | 100.0% |
QualityFirst reproduces the published reduced-model variance components to rounding. Ratios such as %Study Variation are calculated from standard deviations, not by adding the displayed percentages.
Interpretation
What each result contributes to the investigation
- The non-retained interaction means the final model does not estimate a separate Part × Operator variance component.
- Repeatability is the larger measurement-system component in this dataset.
- The operator means differ; operator C has the highest overall mean reading.
- Part-to-part spread and measurement-system spread both contribute materially to total observed variation.
- ndc summarizes separation relative to measurement-system variation; it does not identify the physical cause.
- Suitability still depends on the measurement task, tolerance, risk and applicable customer requirements.
Reproducibility
Sources and licence
- Thomas Roth, Working with the qualityTools package — source design, response vector and reference output.
- CRAN package record for qualityTools — version history and GPL-2 licence metadata.
- The downloadable CSV is an unchanged value-for-value conversion of the vignette response vector into long form; see the accompanying licence file.