Distribution Identification → Normal Capability
Oxide film thickness in a semiconductor furnace
Follow one published industrial dataset from file preparation through distribution assessment, stability diagnostics and capability indices. The example explains the calculations without applying customer- or OEM-specific acceptance criteria.
Published dataset
Process and study structure
The data come from the NIST/SEMATECH furnace case study. A semiconductor manufacturing process grows an oxide film on silicon wafers. The study records film thickness across 21 process runs, four furnace zones and two wafers in each zone.
Input preparation
One readable file for both tools
CSV preview
| run | zone | wafer | thickness |
|---|---|---|---|
| 1 | 1 | 1 | 546 |
| 1 | 1 | 2 | 540 |
| 1 | 2 | 1 | 566 |
| 1 | 2 | 2 | 564 |
| 1 | 3 | 1 | 577 |
| 1 | 3 | 2 | 546 |
| 1 | 4 | 1 | 543 |
| 1 | 4 | 2 | 529 |
Preview: the first of 21 runs.
Column dictionary
- run
- Process run and proposed rational subgroup.
- zone
- One of four positions inside the furnace.
- wafer
- One of two measured wafers in each zone.
- thickness
- Numeric response used by both tools, in Å.
thickness
The remaining columns preserve traceability but are not fitted.
thickness; subgroup size: 8
Keep the file in acquisition order so every eight rows form one run.
Tool 1
Distribution Identification
Assess plausible probability models before capability calculations.
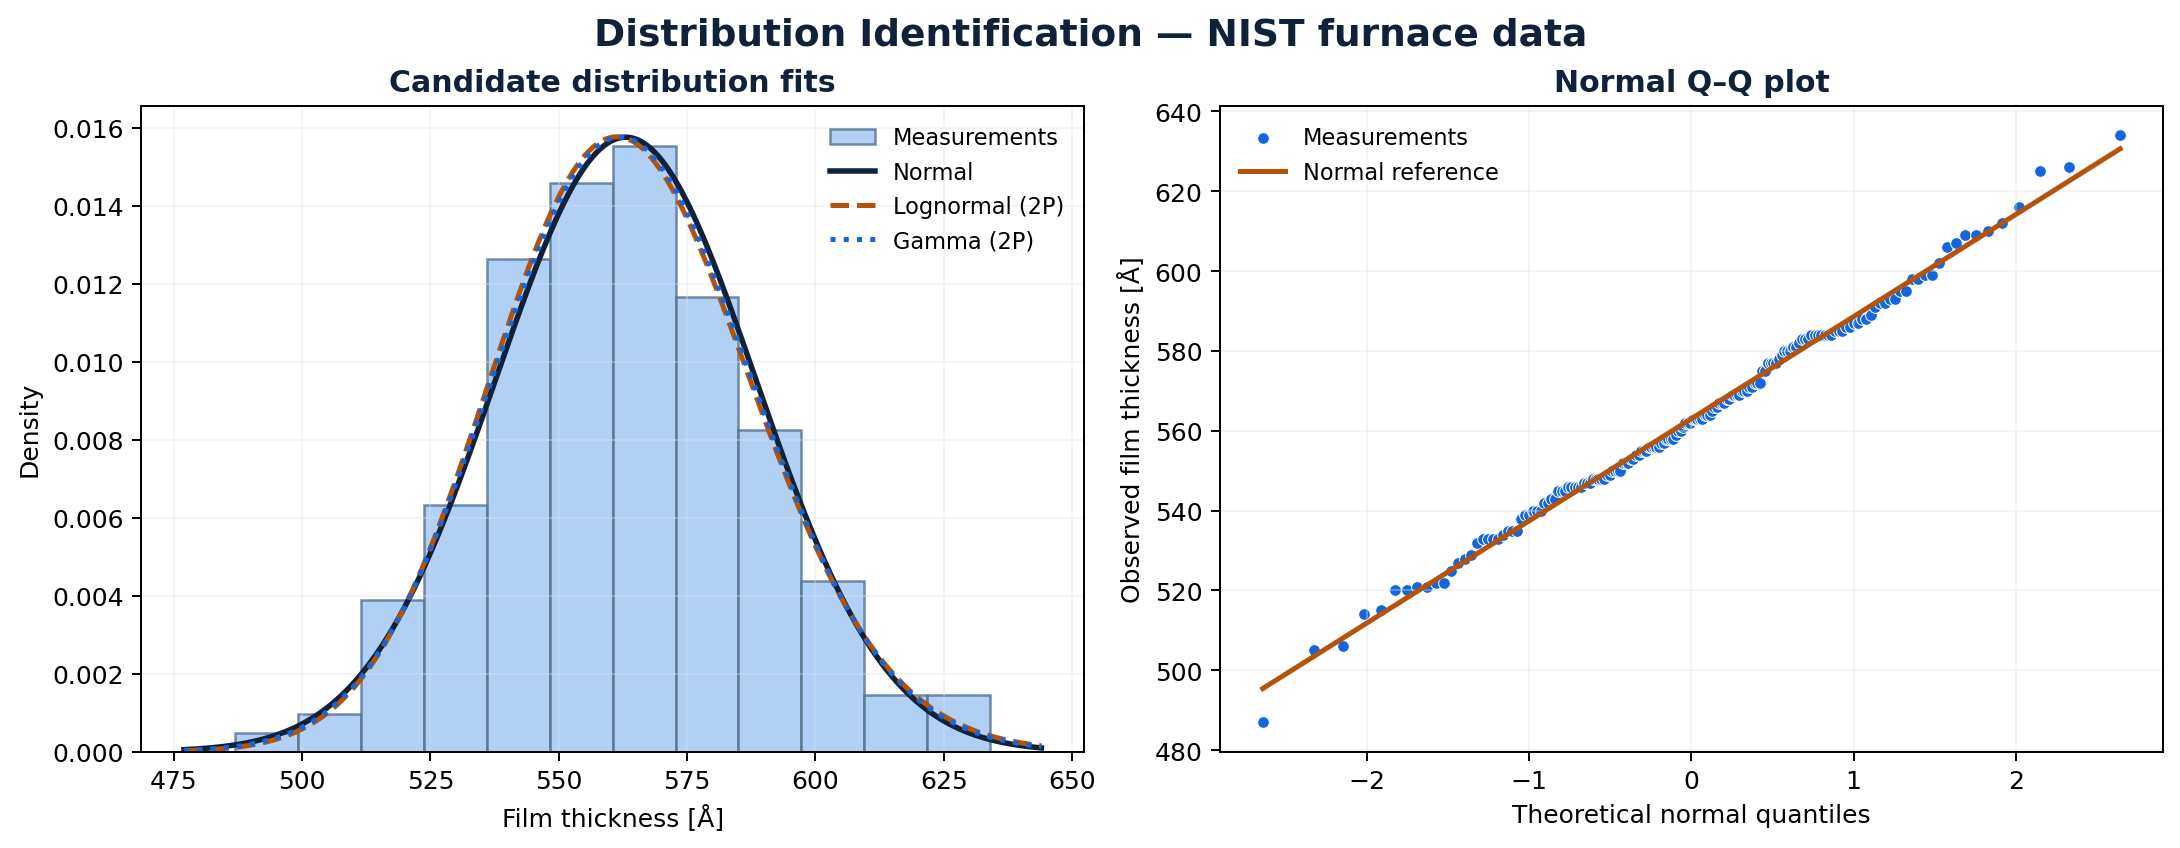
The question is not “Which distribution appears in the first row?” but “Which models describe the observed data adequately for the intended use?” QualityFirst ranks the evaluated candidates by the Anderson–Darling A² statistic and reports BIC as supporting information.
Leading QualityFirst fits
| Rank | Distribution | A² | BIC |
|---|---|---|---|
| 1 | Lognormal (2P) | 0.2217 | 1572.782 |
| 2 | Gamma (2P) | 0.2230 | 1572.631 |
| 3 | Lognormal (3P) | 0.2289 | 1577.714 |
| 4 | Gamma (3P) | 0.2289 | 1577.716 |
| 5 | Normal | 0.2479 | 1572.681 |
How to read the result
- Lower A² indicates a closer fit among the evaluated models.
- The A² differences among the leading models are small.
- The two-parameter BIC values are also almost indistinguishable.
- Process knowledge and diagnostic plots remain part of model selection.
The normal model is retained as a transparent working model for the next section. Its dedicated normality test gives A² = 0.2495 and p = 0.7427; the available data do not provide evidence against normality at α = 0.05.
The model is now carried into a capability analysis that also preserves the process sequence and subgroup structure.
Tool 2
Normal Capability
Evaluate stability, within variation and overall performance.
First check: process stability
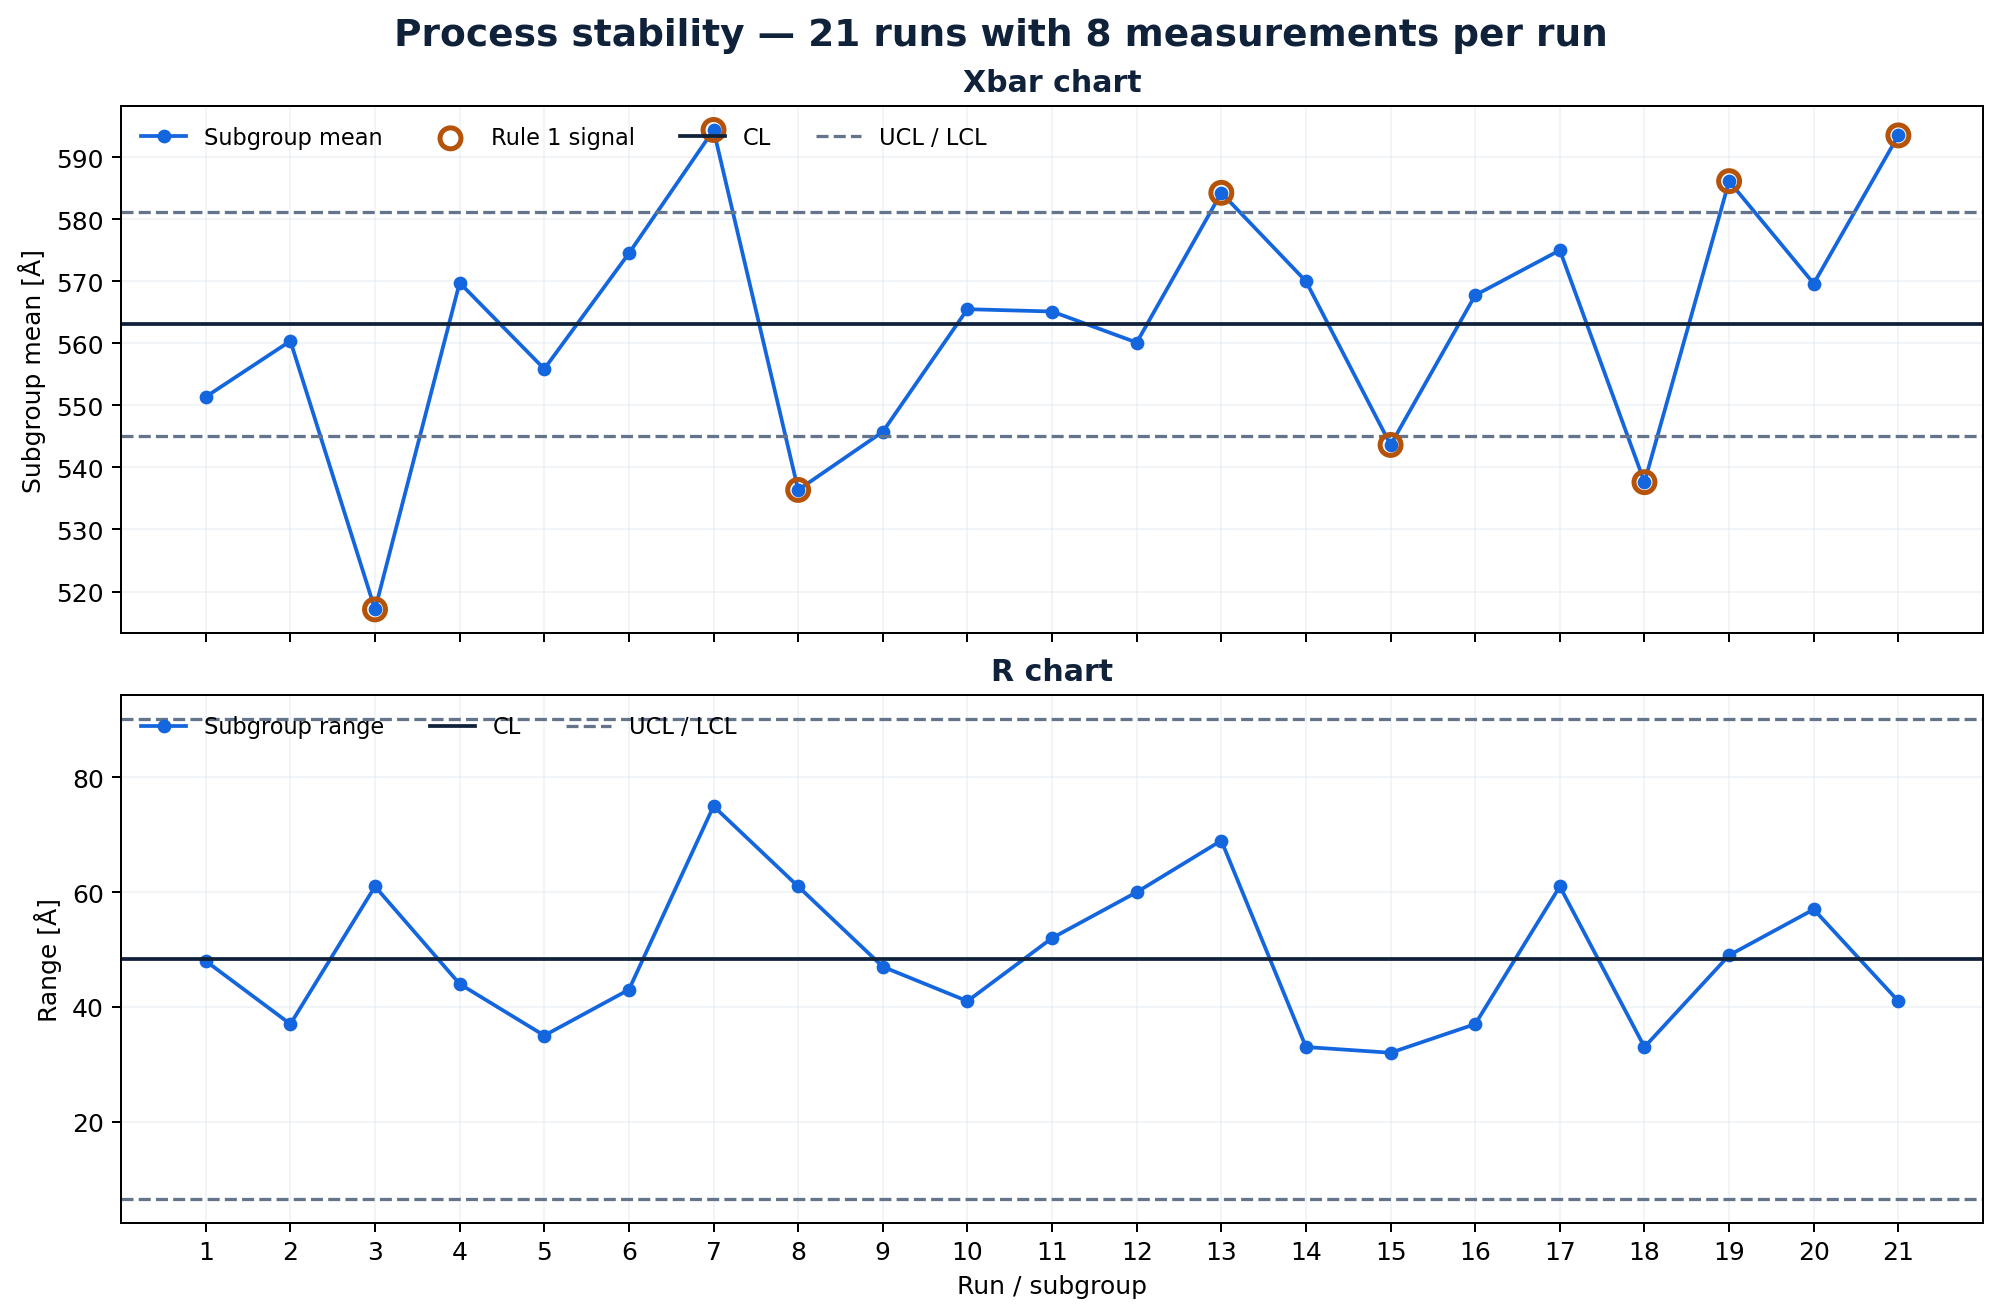
The Xbar–R chart evaluates the acquisition sequence before the capability indices are treated as a description of predictable future performance. QualityFirst currently evaluates Rule 1: a point outside the three-sigma control limits.
Variation estimates
| N | 168 |
|---|---|
| Mean | 563.03571 Å |
| Median | 562.50000 Å |
| StDev Within | 16.99366 Å |
| StDev Overall | 25.38468 Å |
Control limits
| Statistic | Xbar | R |
|---|---|---|
| UCL | 581.0818 | 90.1821 |
| CL | 563.0357 | 48.3810 |
| LCL | 544.9896 | 6.5798 |
Capability and performance indices
Within variation
Overall variation
These values match QualityFirst Pp and Ppk after rounding because the NIST reference calculation uses the overall sample standard deviation. QualityFirst reserves Cp and Cpk for the within-subgroup estimate, so the labels differ even though the comparable numerical results agree.
Neutral conclusion
What this example demonstrates
- Preserve structure. Run, zone and wafer identifiers explain how the measurements were acquired.
- Read fit evidence together. Ranking, BIC, fitted curves, Q–Q behavior and process knowledge serve different purposes.
- Normality is not stability. A plausible normal model can coexist with clear Xbar signals.
- Know the sigma estimate. Cp/Cpk and Pp/Ppk answer different questions when within and overall variation differ.
- Keep acceptance external. Customer and OEM rules must be applied separately to the documented result.
Reproducibility
Sources
- NIST FURNACE.DAT — original dataset
- NIST furnace case study — background and data
- NIST furnace case study — initial analysis
QualityFirst calculations use the 168 observations in the published row order. Displayed values are rounded for readability; calculations use unrounded values.